When WordPress breaks, the most useful information is usually hidden: the exact PHP error, the file it happened in, and the line number. WordPress’s debug mode makes that information visible, either written to a log file or shown on screen. Nearly every fix on this site starts with it.
This guide shows how to turn debug mode on safely, what each setting does, and how to read what it tells you.
The Settings You’ll Use Most
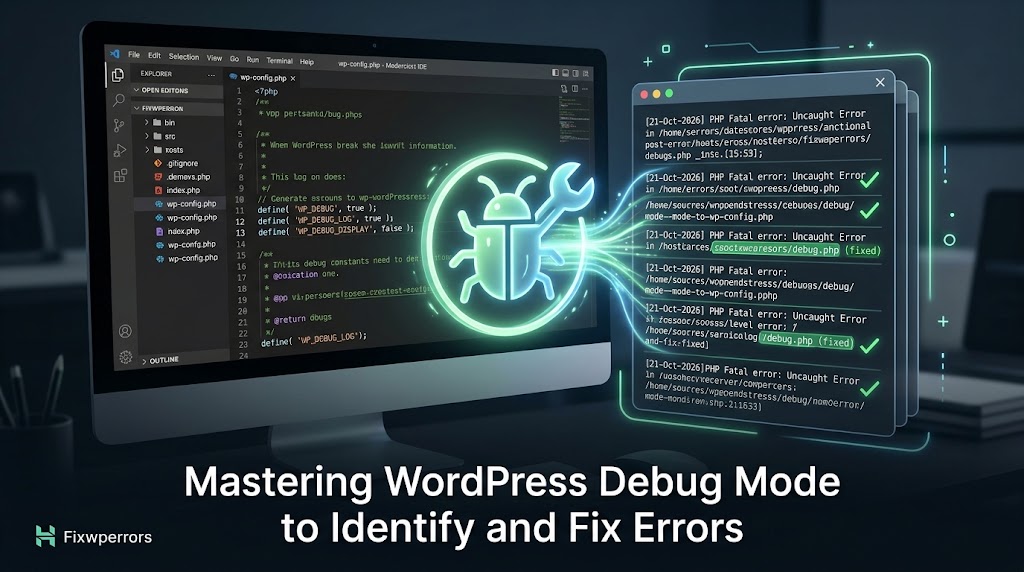
Open wp-config.php in your WordPress root (over SFTP or your host’s file manager), find the existing WP_DEBUG line, and replace it with these three lines. Keep them above the “That’s all, stop editing!” comment:
define( 'WP_DEBUG', true );
define( 'WP_DEBUG_LOG', true );
define( 'WP_DEBUG_DISPLAY', false );
What each one does:
WP_DEBUGturns on debug mode, so PHP reports every error, warning, and notice, including the minor ones normally hidden.WP_DEBUG_LOGwrites those messages towp-content/debug.log.WP_DEBUG_DISPLAYset tofalsekeeps them off the page, so visitors don’t see file paths and code details.
This combination is the right one for live sites. You get a complete log, and visitors see nothing different.
Make sure there’s only one WP_DEBUG line in the file. If it’s defined twice, PHP warns about it and only the first one counts.
Showing Errors on Screen (Local and Staging Only)
On a local or staging site, it’s often quicker to see errors directly on the page. Set WP_DEBUG_DISPLAY to true instead:
define( 'WP_DEBUG', true );
define( 'WP_DEBUG_DISPLAY', true );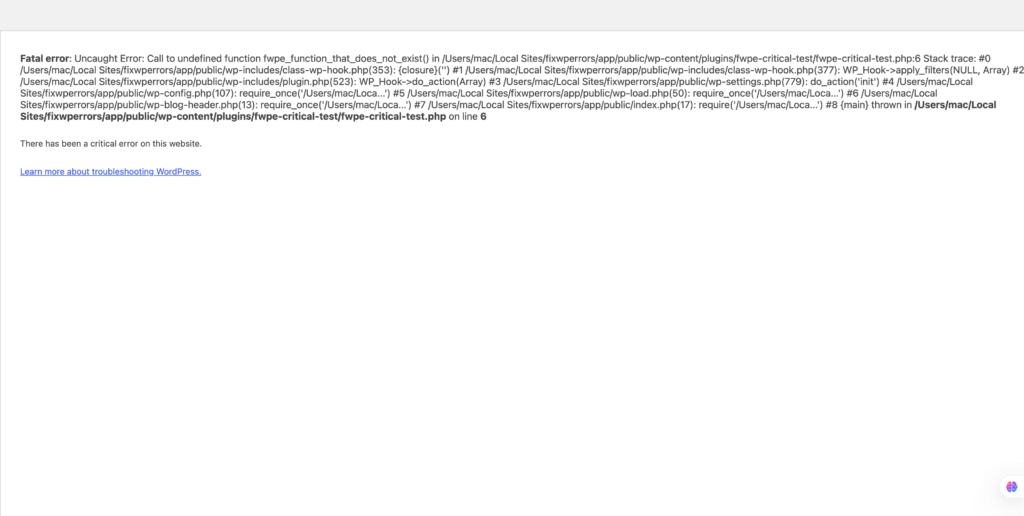
Never do this on a live site. Besides exposing details to visitors, on-screen errors break things themselves: they corrupt AJAX and REST API replies (see our “not a valid JSON response” guide) and cause “headers already sent” warnings.
Reading debug.log
Reproduce the problem, then open wp-content/debug.log. Each entry has a date, a type, a message, and a location:
[21-Oct-2026 14:32:07 UTC] PHP Fatal error:  Uncaught Error: Call to undefined function some_function() in /home/user/public_html/wp-content/plugins/example-plugin/example.php:42
[21-Oct-2026 14:32:07 UTC] PHP Warning:  Undefined array key "title" in /home/user/public_html/wp-content/themes/mytheme/functions.php on line 118
[21-Oct-2026 14:32:07 UTC] PHP Deprecated:  Creation of dynamic property Example::$data is deprecated in /home/user/public_html/wp-content/plugins/example-plugin/class-example.php on line 25
The type tells you how much it matters:
- Fatal error and Parse error stop the page. If the site is broken, this is the line you’re looking for.
- Warning means something went wrong but PHP carried on. Worth fixing, and sometimes the cause of odd behavior.
- Notice and Deprecated are usually harmless for now. They mean code that will break in a future PHP or WordPress version. Many plugins produce them, so don’t panic at a long list of these.
The path tells you who to blame. /wp-content/plugins/name/ is that plugin, /wp-content/themes/name/ is your theme, and /wp-includes/ or /wp-admin/ is WordPress core, which usually means a plugin passed it bad data, or files are damaged. Our critical error guide walks through fixing each kind.
The log grows quickly. To find what’s new, note the time, reproduce the problem, and read only the entries from that moment. Or empty the file first, then reproduce.
Keep the Log Private
By default, debug.log sits in wp-content, which is publicly accessible. Anyone who guesses the URL can read it. Protect it in one of two ways:
Write the log somewhere outside the public folder by giving WP_DEBUG_LOG a path instead of true:
define( 'WP_DEBUG_LOG', '/home/user/logs/wp-debug.log' );Or, on Apache or LiteSpeed, block access to it with .htaccess in your WordPress root:
<Files debug.log>
    Require all denied
</Files>
Either way, turn debug mode off and delete the log when you’re finished.
Other Useful Debug Settings
define( 'SCRIPT_DEBUG', true );makes WordPress load the full, unminified versions of its own JavaScript and CSS. Useful when tracking down JavaScript errors in the admin or block editor, because the Console then shows readable code and line numbers.define( 'SAVEQUERIES', true );records every database query with its timing and the function that ran it. It slows the site down, so only use it briefly, ideally with Query Monitor to display the results.define( 'WP_DISABLE_FATAL_ERROR_HANDLER', true );turns off the “critical error” screen and recovery mode, so fatal errors appear raw. Only useful in development. Remove it afterwards.
Logging Your Own Values
When you’re writing code, error_log() sends anything you want to debug.log, which is much safer than echo or var_dump() on a live site:
error_log( 'Order ID: ' . $order_id );
error_log( print_r( $data, true ) );
Remove these calls once you’ve found what you needed.
JavaScript Errors Aren’t in debug.log
PHP debug mode only covers PHP. If a button does nothing, the block editor is blank, or a form won’t submit, the error is likely in JavaScript. Open your browser’s DevTools (F12) and check the Console tab. For a combined view of PHP errors, slow queries, and hooks on each page, install the free Query Monitor plugin.
When You’re Done
- Set
WP_DEBUGback tofalse, or remove the extra lines. - Delete
debug.log. - Remove
SAVEQUERIES,SCRIPT_DEBUG, and anyerror_log()calls you added.
Summary
Turn on WP_DEBUG with WP_DEBUG_LOG and WP_DEBUG_DISPLAY set to false, reproduce the problem, and read debug.log: fatal and parse errors break the page, warnings are worth fixing, and notices and deprecations can usually wait. Keep the log private, check the browser Console for JavaScript problems, and turn everything off when you’re finished.